YTD and Since Inception (28 August 2020) to the Month Ended 30 September 2021 Performance
Akru’s Investment Philosophy
We construct optimally diversified global portfolios using ETFs with low expense ratios that track the underlying benchmarks closely.
Historical Portfolio Composition
Currently, Akru’s portfolios have 5 ETFs comprising 3 equity ETFs and 2 fixed income ETFs, except for P01-P03 which include an additional 2 local fixed income mutual funds. We calculate portfolios’ total returns, including ETF and mutual fund fees, before any fees payable to Akru.


Source: Morningstar
Since its inception, P04-P010 tracked very closely to their respective benchmarks. The slight tracking differences were generally attributable 3-12bps discount of Developed Market ex-US, Emerging Market and Global Fixed Income ETFs relative to their respective Net Asset Values. The tracking differences in P01-P03 were attributable to the outperformance of the fixed income mutual funds relative to its benchmark.

Source: Morningstar
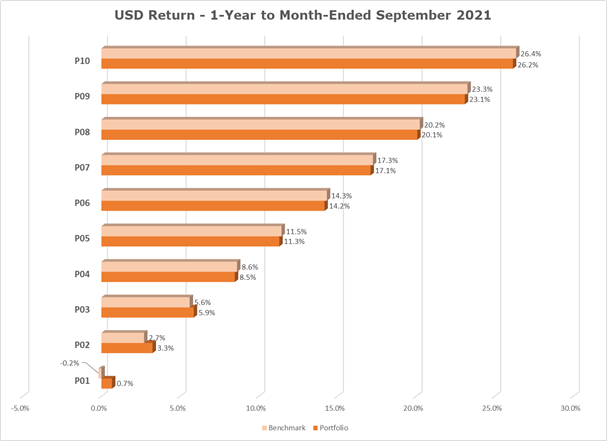
On 1-year basis, the tracking difference for P04-P10 was attributable to 3-23bps discount of Developed Market ex-US, Emerging Market and Global Fixed Income ETFs relative to their respective Net Asset Values. The tracking differences in P01-P03 were attributable to the outperformance of the fixed income mutual funds relative to its benchmark.


Source: Morningstar
On a YTD-2021, P04 and P10 tracked very closely to their respective benchmark. The tracking differences in P01-P03 were attributable to the outperformance of the fixed income mutual funds relative to its benchmark. The tracking differences for P09-P10 were due to slight premium of Developed Market ex-US, Emerging Market and Global Fixed Income ETFs relative to their respective Net Asset Values.

Globally, the major equity markets are still up strongly over the period under review, contrasting to the fixed income market where some investors are facing losses. In July and August, the US Market climbed higher on optimism about US economic recovery. However, the global market fell back from its highs amid worries about the coronavirus’s delta variant’s impact on the economy; supply chain slowdowns leading to shortages across several key industries; a regulatory crackdown on Chinese Tech companies; and potential collapse of Chinese property giant, Evergrande. A jump in US Treasury yields also weighed on the market. Rising US bond yields and the news surrounding Chinese stocks added some volatility and poor performance to the emerging market index.
The 3Q21 began with a rally in the fixed income market as the prospect of a slower recovery pushed the yield on the 10-year US Treasury note to its lowest level since February 2021. But after a higher-than-expected inflation forecast from the Federal Reserve and an indication that it could raise interest rates next year, bond prices fell back, and yields rose.
However, the portfolios’ total returns translated to RM since inception and 1-year basis are lower as Ringgit appreciated slightly by 0.32% and 0.96% respectively. Whereas on a YTD basis, total returns are higher by 4.36%, as the Ringgit depreciated.


Source: Morningstar


Source: Morningstar


Source: Morningstar
Benchmarks
We use market indices that mimic how the underlying ETFs and mutual funds perform to construct the blended benchmark, which comprises the following and according to each portfolio’s respective asset allocation.
| Asset Class | Benchmark |
|---|---|
| Developed Market Equities Large Cap (ex-US) | MSCI EAFE |
| US Equity Large Cap Blend | S&P 500 |
| Emerging Market Equities | MSCI Emerging Market |
| Global Fixed Income | Bloomberg Barclay Global Aggregate Ex USD Float Adjusted |
| US Fixed Income | Bloomberg Barclay US Aggregate Float Adjusted |
| Malaysia Fixed Income | Markit iBoxx ALBI Malaysia |

Disclosures
Past data and performance do not indicate future performance. Actual individual investor performance will vary depending on the initial investment, amount and frequency of contributions, allocation changes, taxes and fees during the time frame considered.

