Investing is critical - The cost of retiring continues to rise, and the challenge of investing grows more complex. This makes it even more critical to cut through the noise and get started building your wealth.
Well begun is half done –The reality is that the most important element of building wealth is to start to invest;at Akru, we make investing simple. We apply modern finance theory and practice to give you a series of standard portfolios at various risk levels. Pick the one that’s right for you and start Akru’ing!
Volatility is not risk (until you make it so) – There are two critical risks when investing: 1) losing money and 2) not having the money you had planned to have at a future point in time. When you sell an investment at an amount lower than you bought it, you lost that money. We assess the possibility of this risk happening by considering the probability of a large fall in your investment (what is called a drawdown) and a behavioral assessment of the likelihood that you would sell when it does go down. The mere fact that an investment goes up AND down does not mean it is high risk. To us, volatility is not risk; however, if you sell an investment after it has fallen, then you have turned that volatility into risk.
Matching investors’ risk profile with a suitable portfolio – Through our risk assessment survey, we determine an investor’s risk profile on a scale from 1 to 10, where 1 is the most risk-averse and 10 is the highest risk appetite. Since most risk-averse investors are not able to stomach high volatility, the low-risk portfolios have a higher allocation to bonds and lower to equities. In the world of finance, Modern Portfolio Theory (MPT) taught us that we could reduce a portfolio’s volatility by combining less correlated or negatively correlated assets. Optimizing portfolios according to MPT, though, requires forecasted variables, which evidence supports are likely to be incorrect. Another option is to use historical data for such optimization, but the outcome will just tilt the portfolio in favor of the previously best-performing assets. So if forecasts are inaccurate and historical data is not reliable, what can we rely on? One thing has been true for centuries, and that is that on bonds are less volatile and less risky than equities. We rely on this to create portfolios for the different risk levels based on equity vs. bond target allocations. The least risky portfolio has a 5% allocation to equities and 95% to bonds, while the riskiest has a 95% allocation to equities and 5% to bonds.
Our core investing beliefs – We hold a few core investing beliefs: 1) owning shares in businesses is the best long-term opportunity, 2) diversifying across many businesses considerably reduces the risk of any one business doing poorly, 3) owning a share of businesses across the world reduces the risk of exposure to a possibly poorly performing home country, 4) that diversifying across asset classes also substantially reduces risk, and 5) that no one can consistently predict the future.
No other investment has earned a higher return over the longest period than investing in shares of businesses. Therefore, the foundation of our investment strategy starts with owning shares in businesses. Our first objective is to bring you that exposure to businesses at the lowest level of risk.
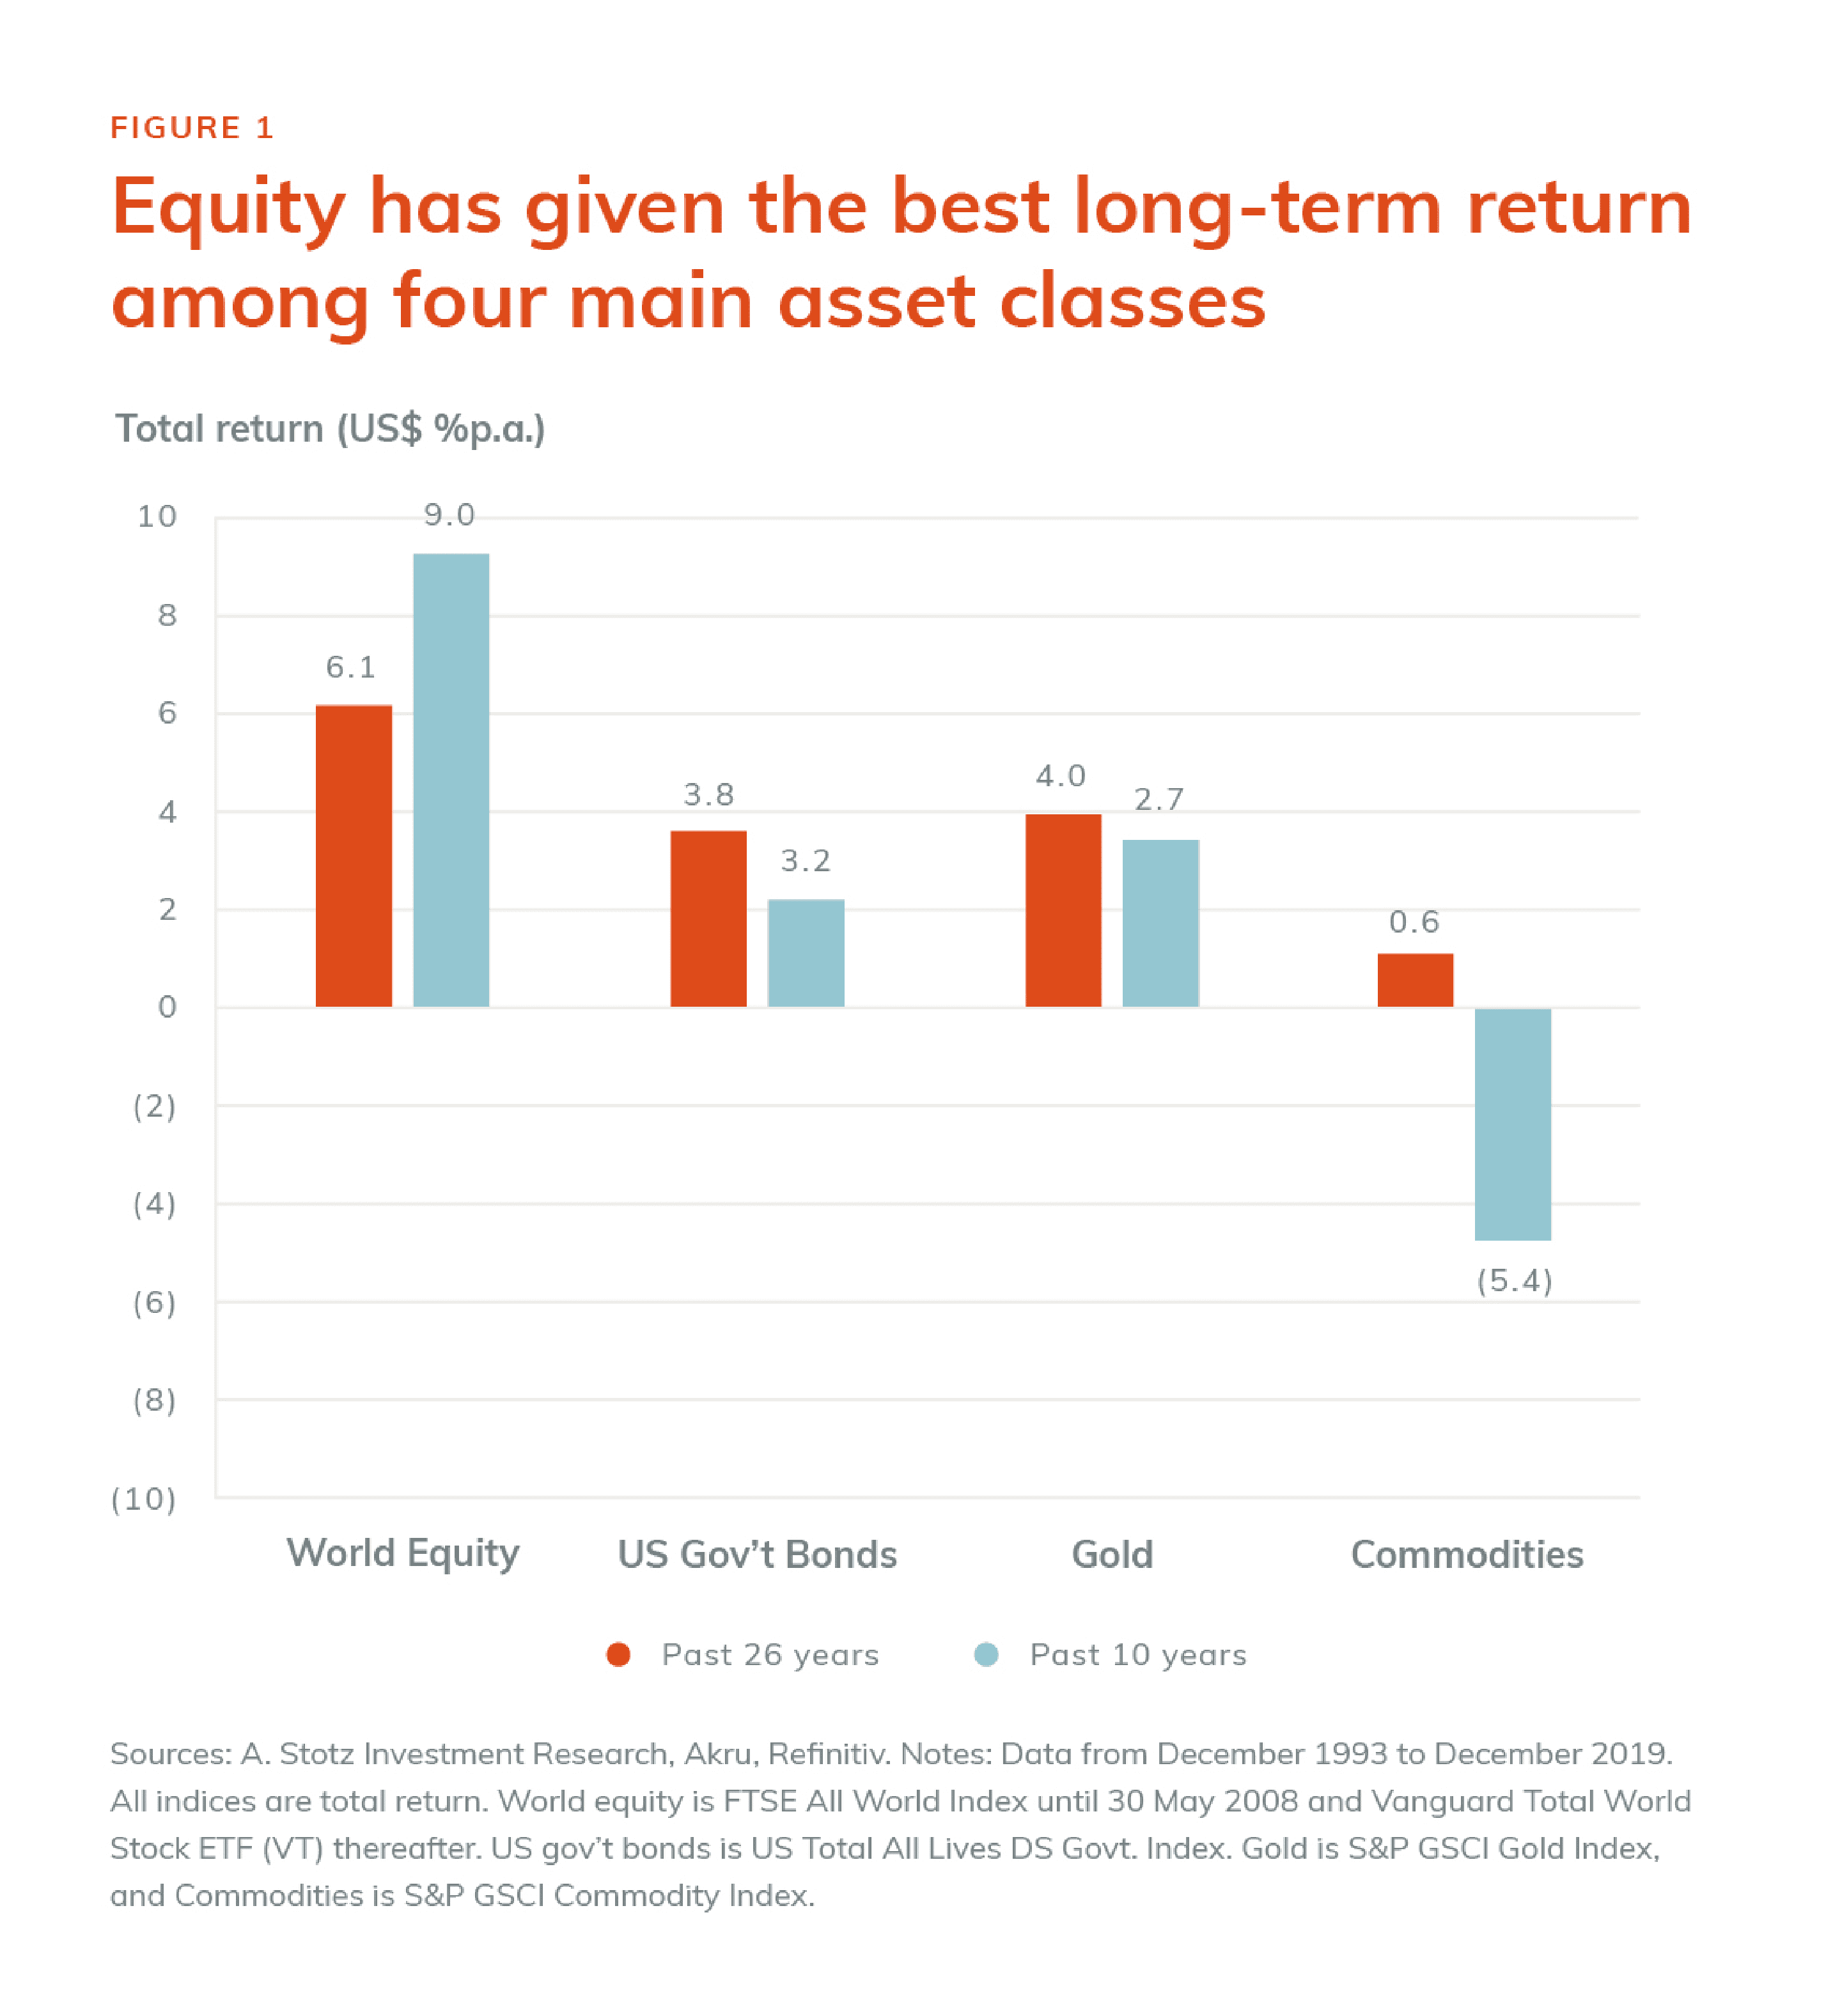
The core of any long-term capital growth strategy starts with equity. Owning a share of business has been proven over the years as the assets class with the highest long-term return, which you can see in Figure 1. Of course, owning a share in just one company, say a hotel, would leave an investor over-exposed to that company if something went wrong.
In this example, to avoid overexposure to this one hotel company, an investor could own shares in many hotels. Unfortunately, this would leave the investor overexposed to that one industry. If tourism were to fall, then the shares in all the hotels in the hotel industry would fall, and the value of the investor’s portfolio would fall with it.
To remove the risk of overexposure to any one industry, an investor can invest in all companies, hence all industries, in their home market. This still leaves the investor exposed to the risk that their home market does not go up by much over a long period.
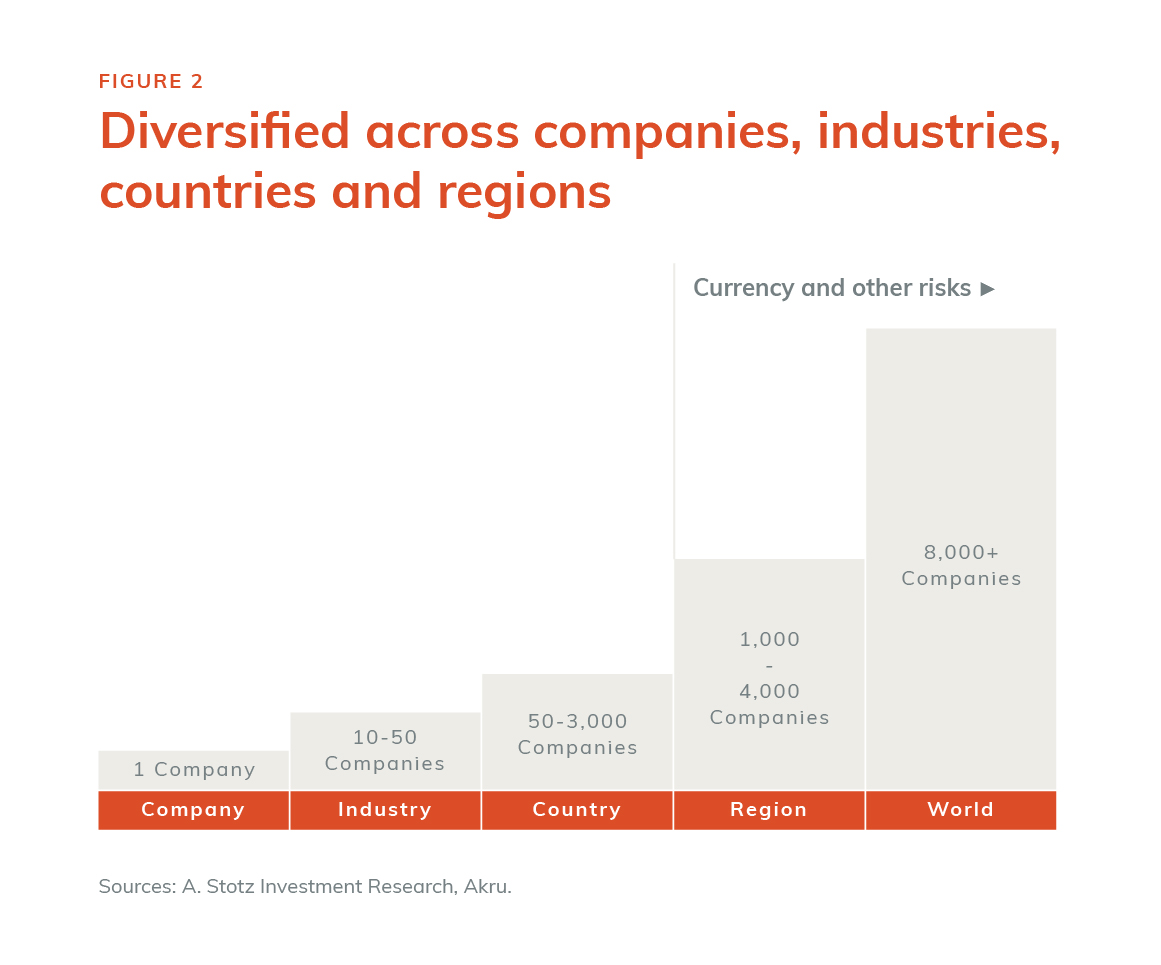
In Figure 2, the risk reduction from diversification is pictured. To remove the risk of their home market falling over a long period, an investor could expand into the nearby region and own all companies in it, e.g., North America, Europe, Pacific, or Emerging Markets. In this case, the investor would have removed the risk of overexposure to their home market, but would still be exposed to the risk that the region they live in performs poorly. By going outside the home market, currency risk arises, which is the risk that the investment currency falls in value relative to their home currency.
The final step in this example of reducing risk is to own equity in every company in the world. This would be the most diversified an investor could get. Diversified across companies, industries, countries, and regions. It would also mean the investor is diversified across currencies. One of the broadest instruments in the market allows investors to own more than 8,000 stocks across all regions in the world.
Our portfolio construction starts with the principle that having broad equity exposure to every company in the world gives the highest long-term returns and minimizes the various types of risk mentioned above.
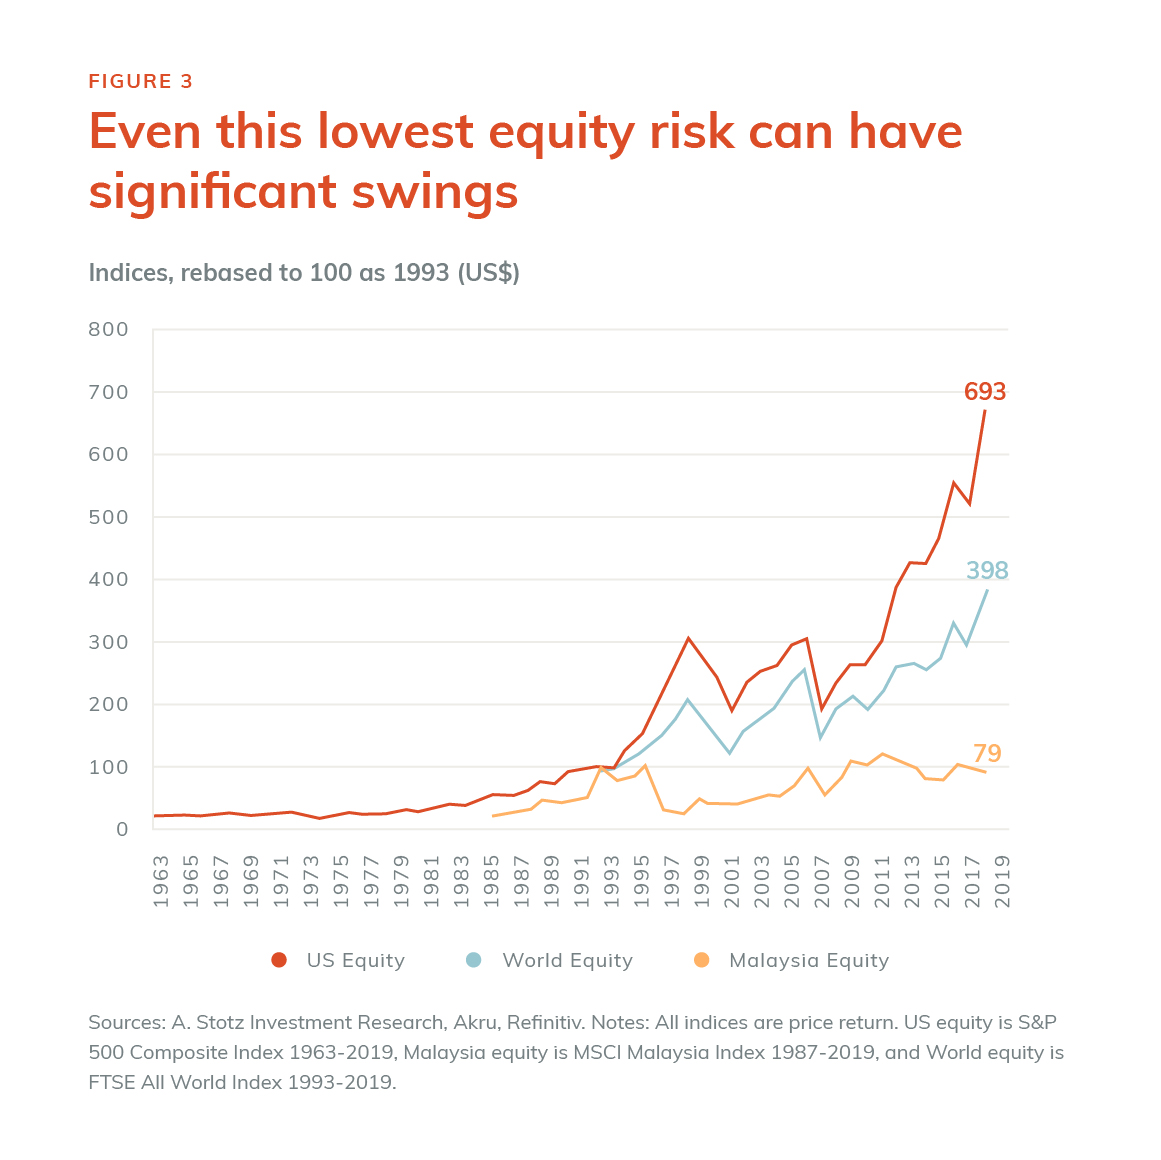
Since 1993, when the World equity index started, US equity has performed the best by far. Malaysia has not recovered to the levels before the 1997 Asian Financial crisis. Figure 3 highlights the importance of diversification across countries and regions, and that even such a diversified portfolio can experience significant swings. The worst year for the World equity index since 1993 was 2008 when the market dropped by 40%.
The core of any long-term capital growth strategy starts with equity. The key risk of owning shares of all businesses is that it is one of the few asset classes where an investor could lose a large part of their money. Figure 4 shows that in the worst years for the US equity market over the past 148 years, there were nine times that the US stock market lost more than 20% in any one year, worst was 1931 when the market lost 45%.
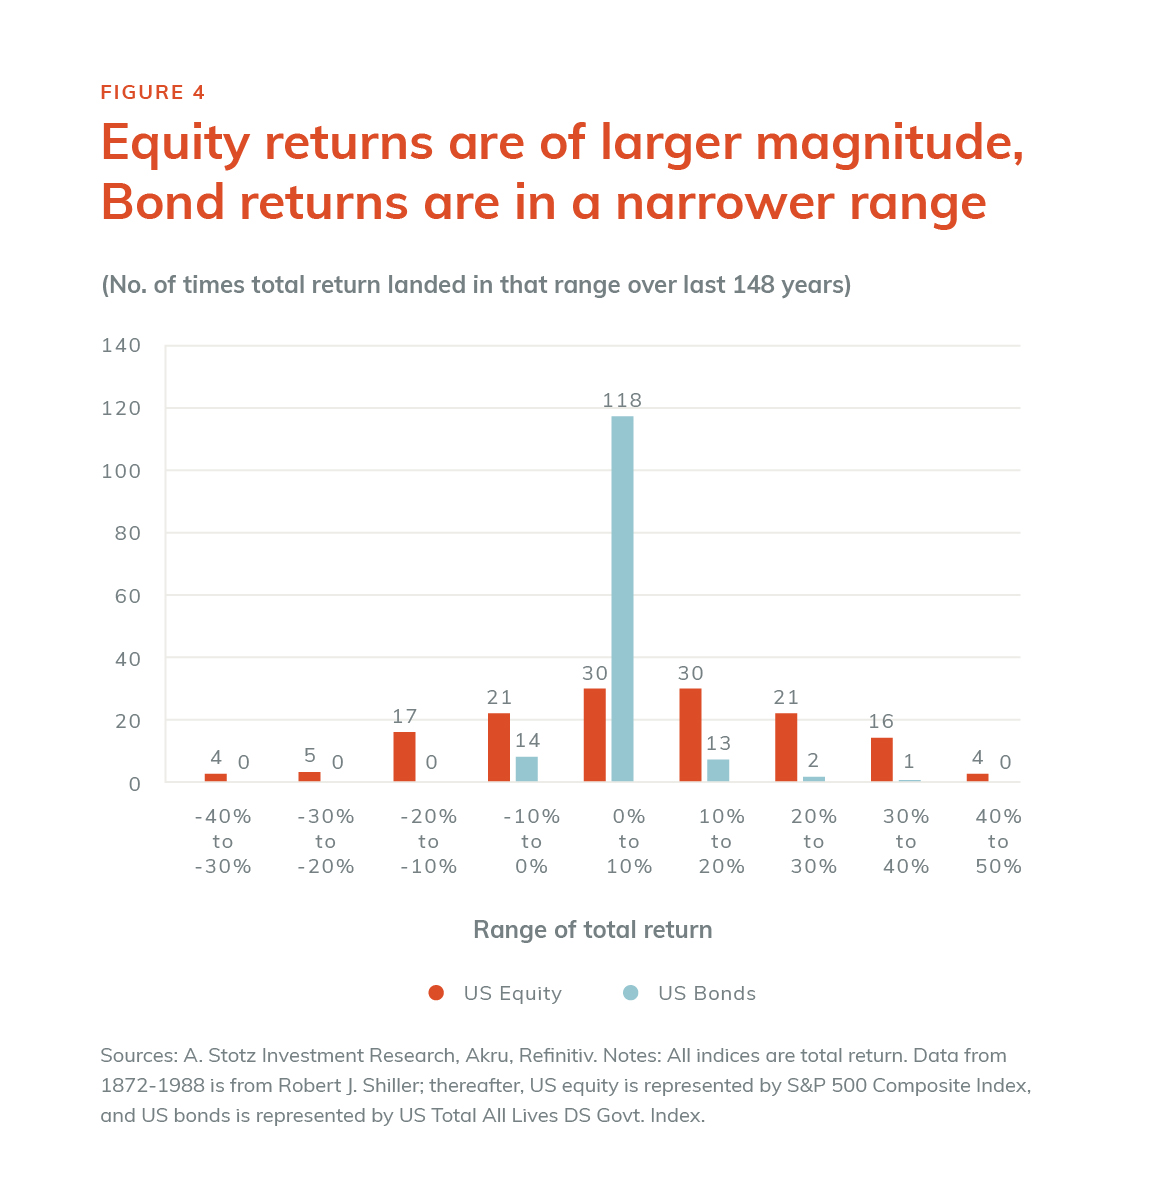
This is different from bonds, which never lost more than 10% in the past 148 years. Bonds have also rarely returned more than 20% in any year. In summary, bond returns vary in a narrower range than equity. Equity offers the potential of much higher returns.
No assets class has shown as high long-term returns as equities. Since companies are run by management teams that are working to adapt to a changing environment, it is reasonable to think that, on aggregate, management teams will continue to strive to produce long-term returns. This is not the case with other asset classes, such as bonds or commodities. Therefore, the other asset classes are held not for their expectation of a high long-term return but rather for some other benefit.
The primary benefit is to take the edge off the major falls in equities. This is accomplished in two ways: First, when equities prices are falling, having a portion of money in another asset gives you less exposure to that equity fall. Second, is the hope that the other asset class is less correlated to equity prices. The best case would be that this other asset class goes up when equities go down. Unfortunately, this rarely occurs, so the next best case is that this asset class sits flat when equities go down. Many times, though, you have to be satisfied that this asset class goes down less than equity goes down.
Common asset classes are Equities, Bonds, Commodities, Gold (sometimes included in commodities), and Real Estate. There are other asset classes, such as art; however, the problem is that there are few instruments that can give exposure to this type of asset class.
All the theoretical testing that we have done until now has been based upon indices that represent the main asset classes. Next, we must identify suitable instruments that give reasonable exposure to each asset class. These instruments are usually exchange-traded funds (ETFs), investment funds traded on the stock market.
The target allocations of each asset class are based on Akru’s estimate of the best combination of asset classes that would achieve the appropriate characteristics for each of the ten levels of risk you can choose from. From this, an investor must decide their level of risk tolerance and then buy the portfolio that fits them.
Though no one can consistently predict the future, there are times that an investor may want to increase or decrease the riskiness of their portfolio. In the case of an investor who wants to reduce the risk, they need to allocate a portion of their funds to a lower risk portfolio.
Once an investor owns their optimal portfolio, they can let the magic of compounding work in their favor by staying invested for the long-term. The Akru Investment Committee makes two types of adjustments to the weight in your portfolio. The first is a soft adjustment that changes the allocation of your contribution based upon the portfolio’s movement from its target allocation. For example, say that the target allocation is 50% stocks, 50% bonds. If you were to contribute 100 to your portfolio during any given month, it would be equally distributed to stocks and bonds. However, now imagine that the stock market has risen so much that the value of the stocks in your portfolio has moved from 50% to 59%; in this case, we would allocate the 100 you contributed to the bond portion of your portfolio, attempting to marginally (or softly) rebalance your portfolio.
Then once a year, our Investment Committee does a hard rebalance back to target allocations if a drift of 5% or more exists in any allocation. Consider that at the end of the year, the allocation in your portfolio is 59% stocks and 41% bonds, but your target allocation is 50/50. In this case, the Investment Committee will sell the extra 9% from the rise in stocks and allocate that money to bonds. This hard rebalance would bring your portfolio back to 50% stocks and 50% bonds. Of course, the Investment Committee will also always consider the impact of expenses and taxes before making the final rebalance.
This methodology allows you to gain a bit from the rise in stocks but within a tight framework.
Start your journey by considering which person you are most like. First, there’s Low-risk Larry. What’s most important to Low-risk Larry when Akru’ing is that his investment does not fall by much during stock market downturns. Low-risk Larry knows that he must give up some future gains in his portfolio in exchange for the assurance that his portfolio will not crash when the stock market crashes. At the other end of the spectrum is High-risk Harry. High-risk Harry is focused on growing his wealth, and he is willing to ride the rollercoaster of the market to get there. Low-risk Larry, on the other hand, is happy to watch on the sidelines while High-risk Harry rides the rollercoaster over the market’s ups and downs. Finally, meet Moderate Mary, who is in the middle; she does not want too high of risk or too low of return.
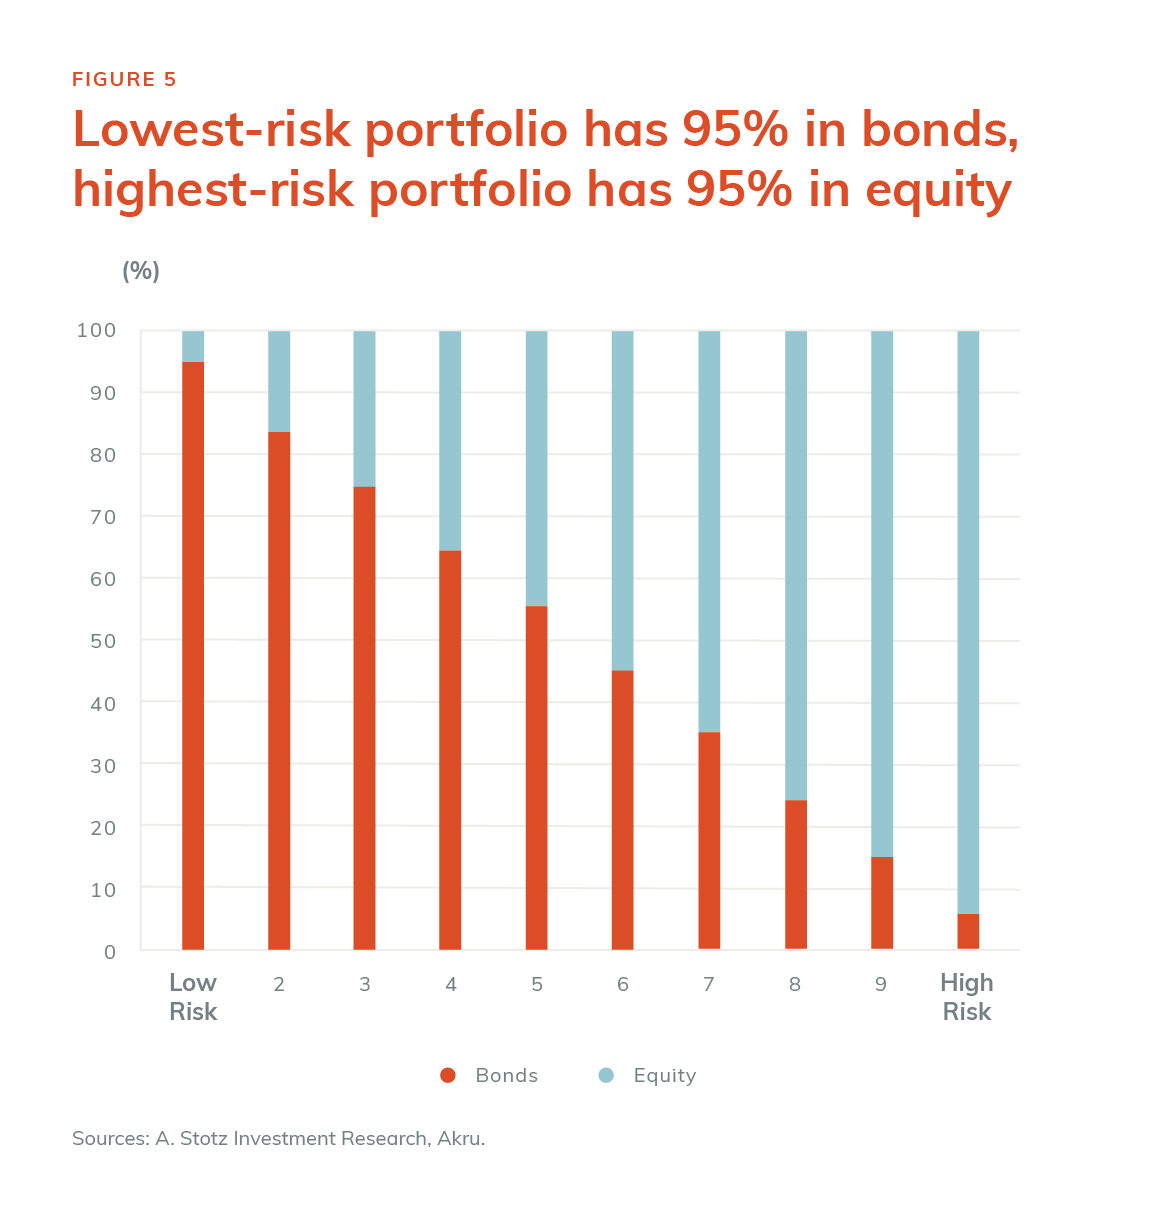
At Akru, we provide ten different portfolios, each with a rising level of risk. In Figure 5, Portfolio #1 is the lowest risk portfolio, while #10 is the highest. Back to our example, in this case, Low-risk Larry would feel most comfortable putting his money in portfolio #1, which is comprised of a target 5% equity allocation and 95% bonds. On the opposite side is High-risk Harry, who wants to put his money into portfolio #10. He is hoping to gain from the portfolio’s maximum exposure to the equity market at 95% equity and 5% bonds. Finally, Moderate Mary is happy with portfolio #5, which targets a 45% equity allocation, with 55% remaining in bonds.
Let’s step back and look at annual performance. From 1994 to 2019, the stock market has returned about 8.0% per year; this compares to a slightly lower 5.3% per year for the bond market. This was a particularly strong period for the bond market as interest rates were falling, causing bond prices to rise. The maximum annual return for stocks since 1994 was 34.4% vs. a maximum of 18.4% for bonds. The minimum for stocks was -40.1%, and for bonds, it was -3.7%. Finally, in 19 out of 26 years (73% of years), returns were positive for the equity market and were positive for 21 years (81% of years) for bonds.
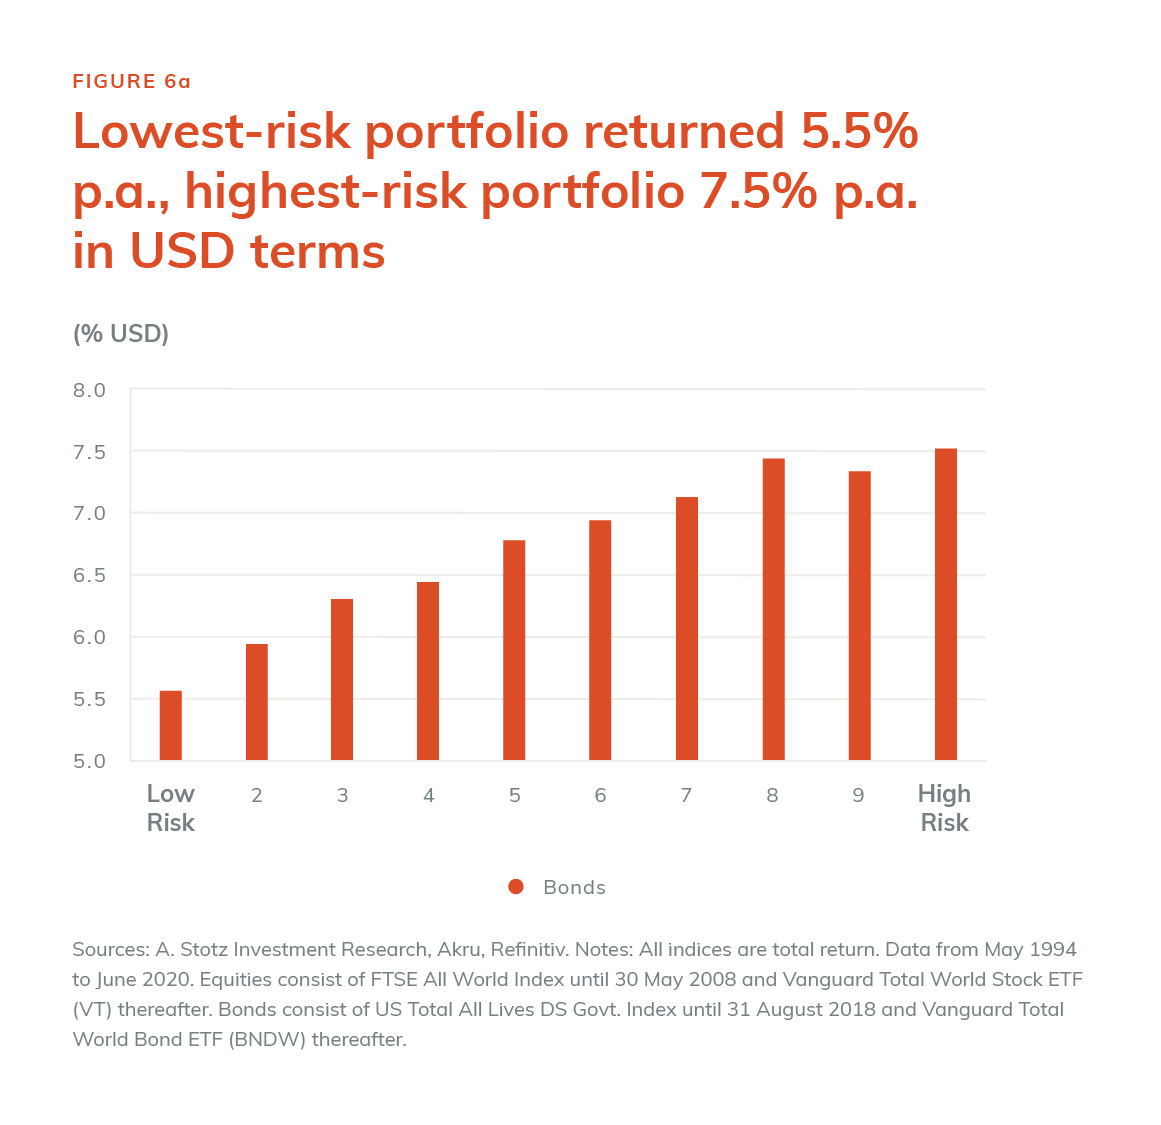
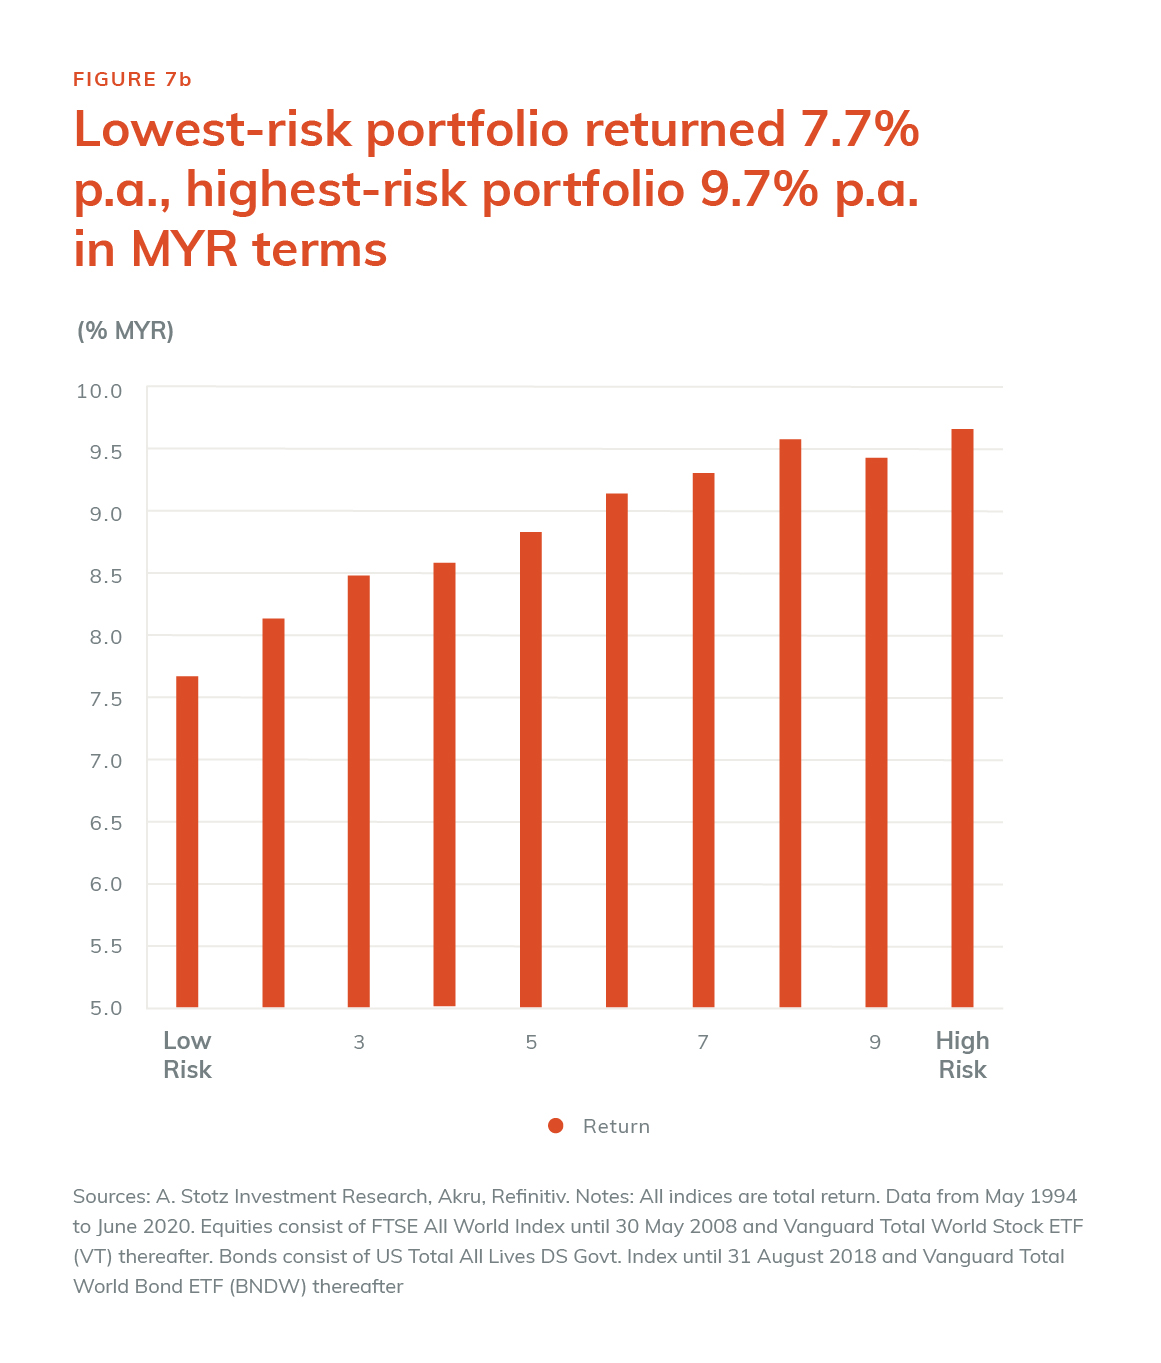
In Figure 6a, you can see that the combination of bonds and stocks produces a mix of returns. Low-risk Larry would have experienced a portfolio return of 5.5%, while High-risk Harry had a slightly higher return of 7.5%.
The stock market is like a rollercoaster, going from extreme highs to extreme lows. People like High-risk Harry are comfortable with that ride. Volatility, as measured by the standard deviation of returns, tells us how high the highs were and how low the lows were. From 1994 to 2019, the volatility of the equity market on its own was 15.1% compared to the bond market of 4.0%. As shown in Figure 7a, Low-risk Larry experiences volatility of 4.0% because he is very heavily weighted in bonds. In comparison, High-risk Harry doesn’t mind the high volatility of 14.8% that he experiences for holding portfolio #10.
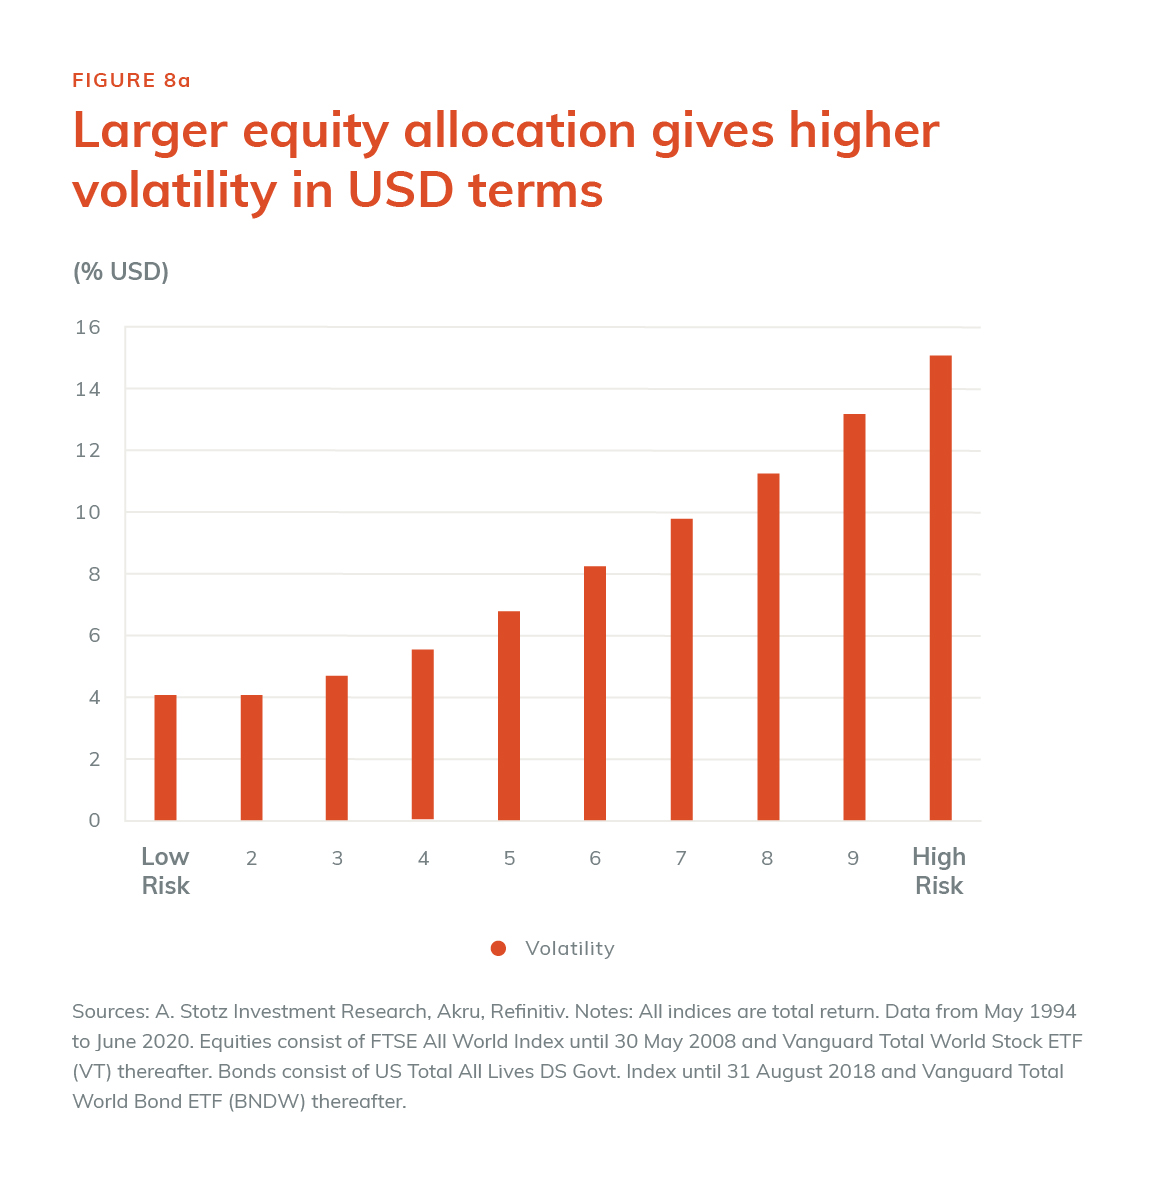
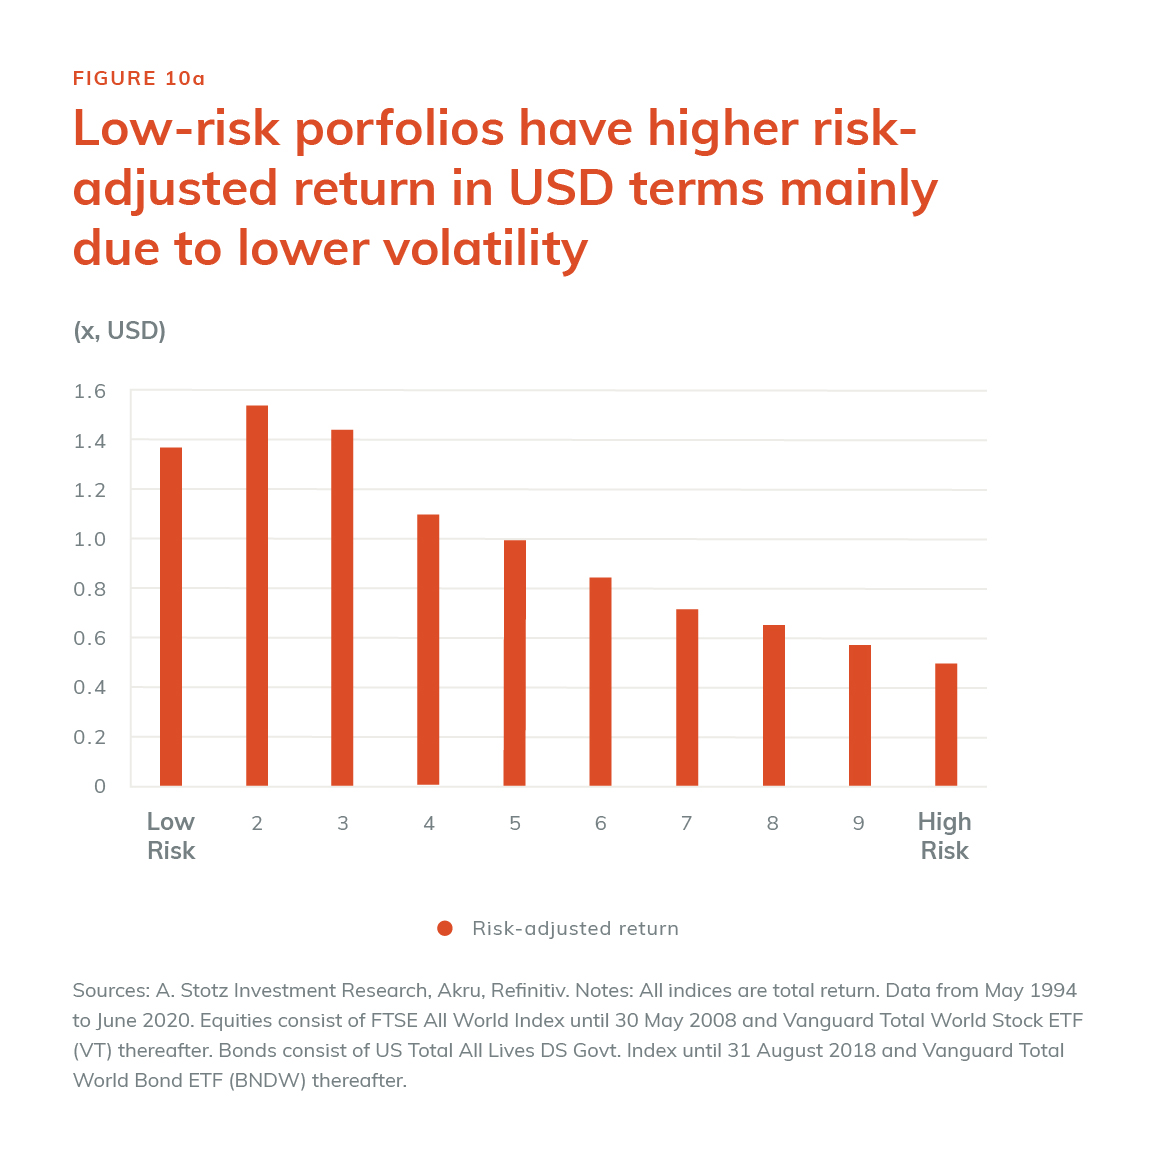
Moderate Mary wants a balance of risk and return, and one simple way of understanding this is to divide the return by the risk. See Figure 8a and consider portfolio #5, which has a return of 6.7% and volatility of 6.8%, so a risk-adjusted return of 1.0x. Portfolio 10, on the other hand, had a risk-adjusted return of 0.5x.
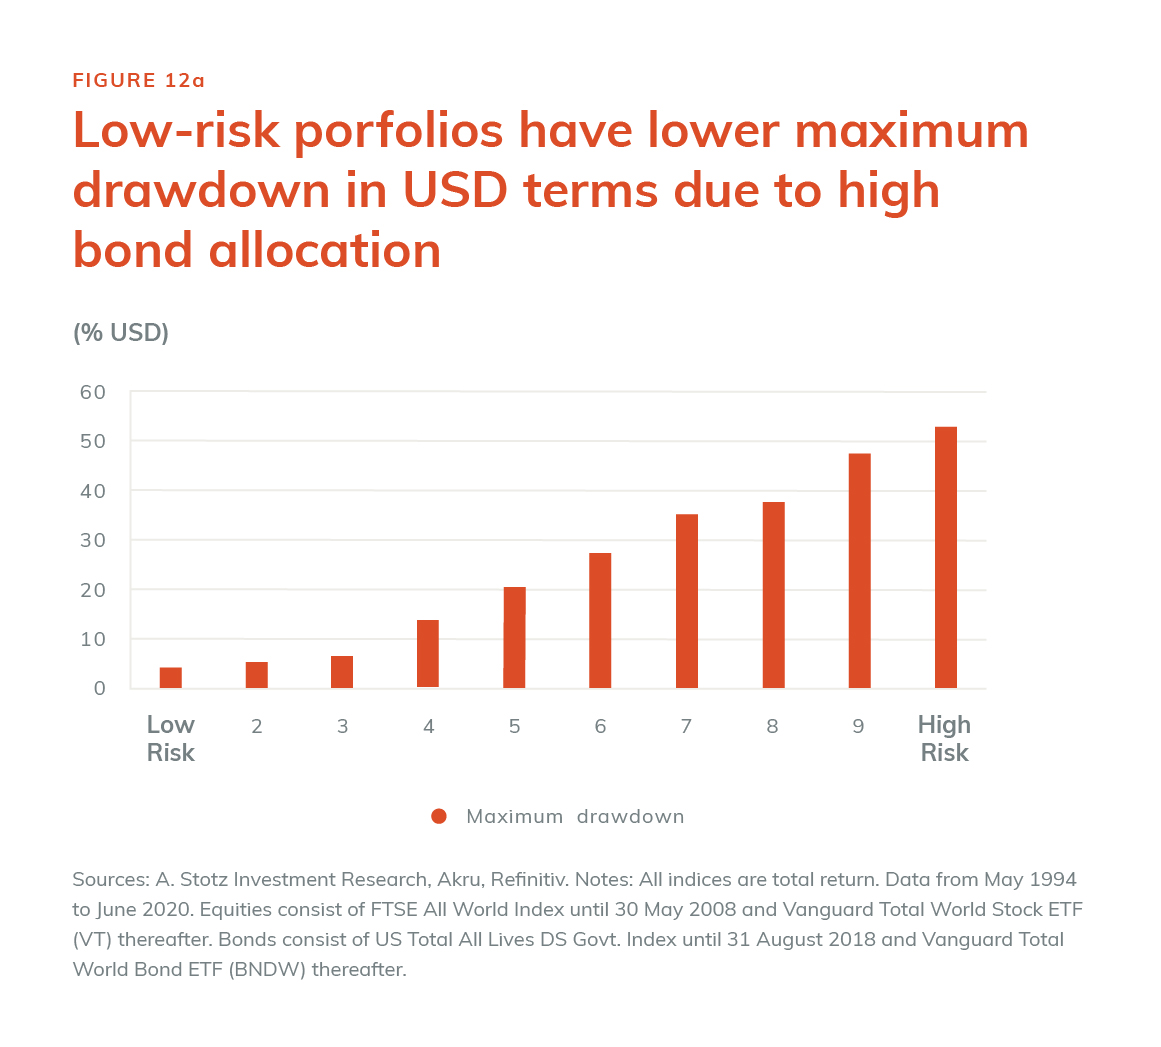
The first step in reducing risk is to own every stock in the world; the second is to hold a portion of other assets classes that move either less than equity or that move in the opposite direction. This is done by mixing in bonds with an equity portfolio. The result should cause the overall portfolio to go down less. A common measure for this is “maximum drawdown,” which tells us, during this period, what was the most that the overall portfolio fell. Figure 9a shows that if the portfolio was either of the lowest risk portfolios, #1 or #2, the worst drawdown was 5% or less. On the other hand, portfolio #10 experienced a maximum drawdown of 52%. Of course, that does not mean that this portfolio is worse; it just means that you must be willing to bear these maximum drawdowns, and stay invested, to get the much higher upside that portfolio #10 achieves.