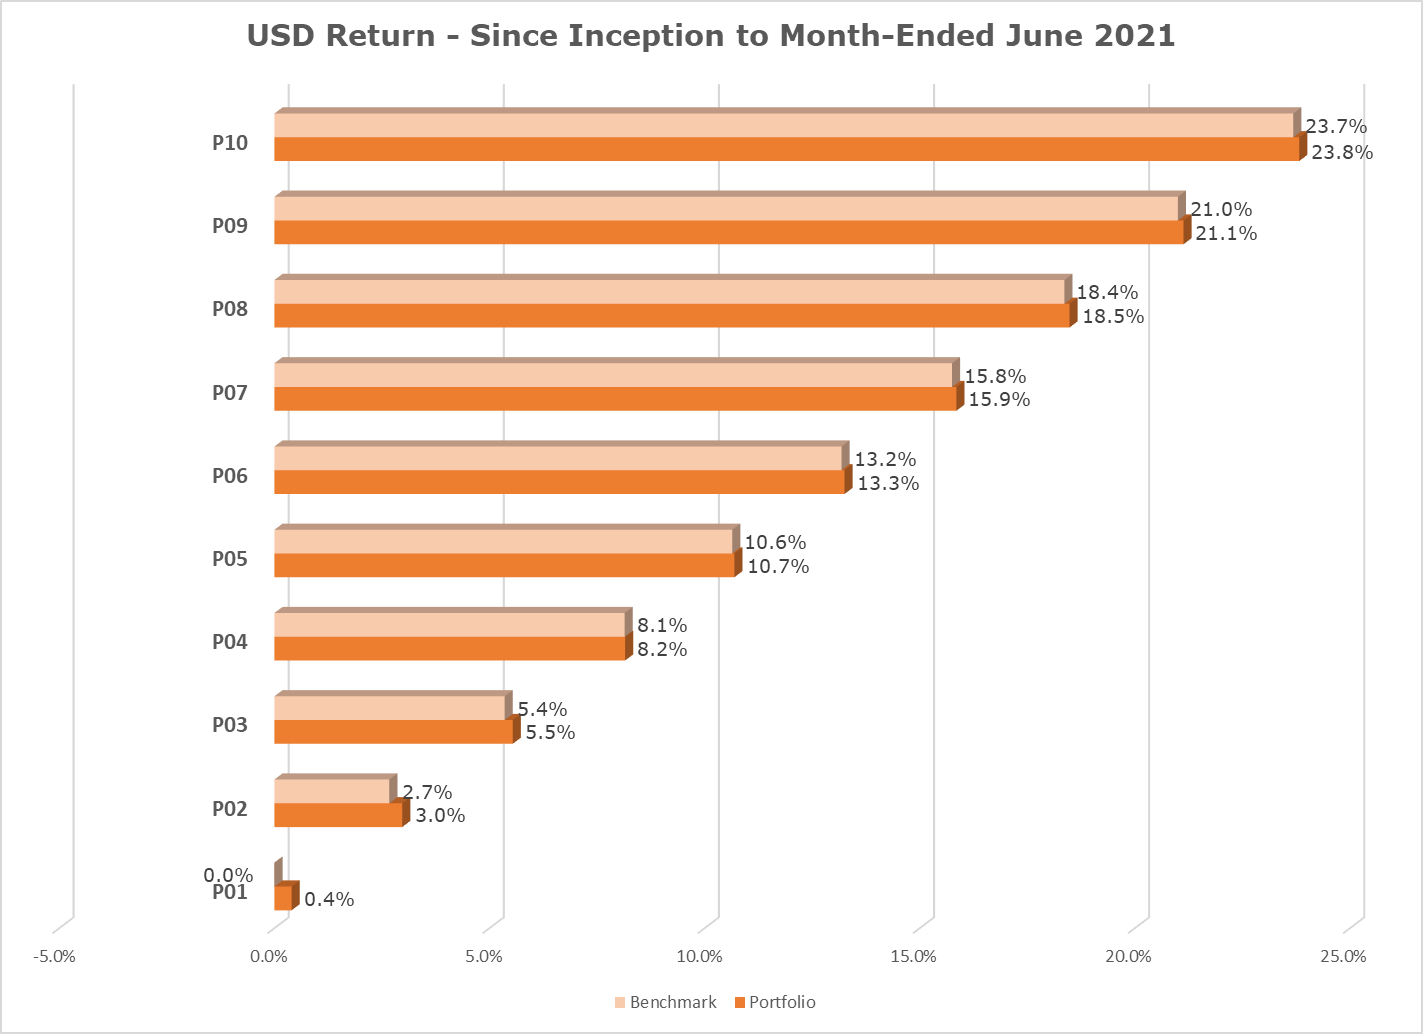
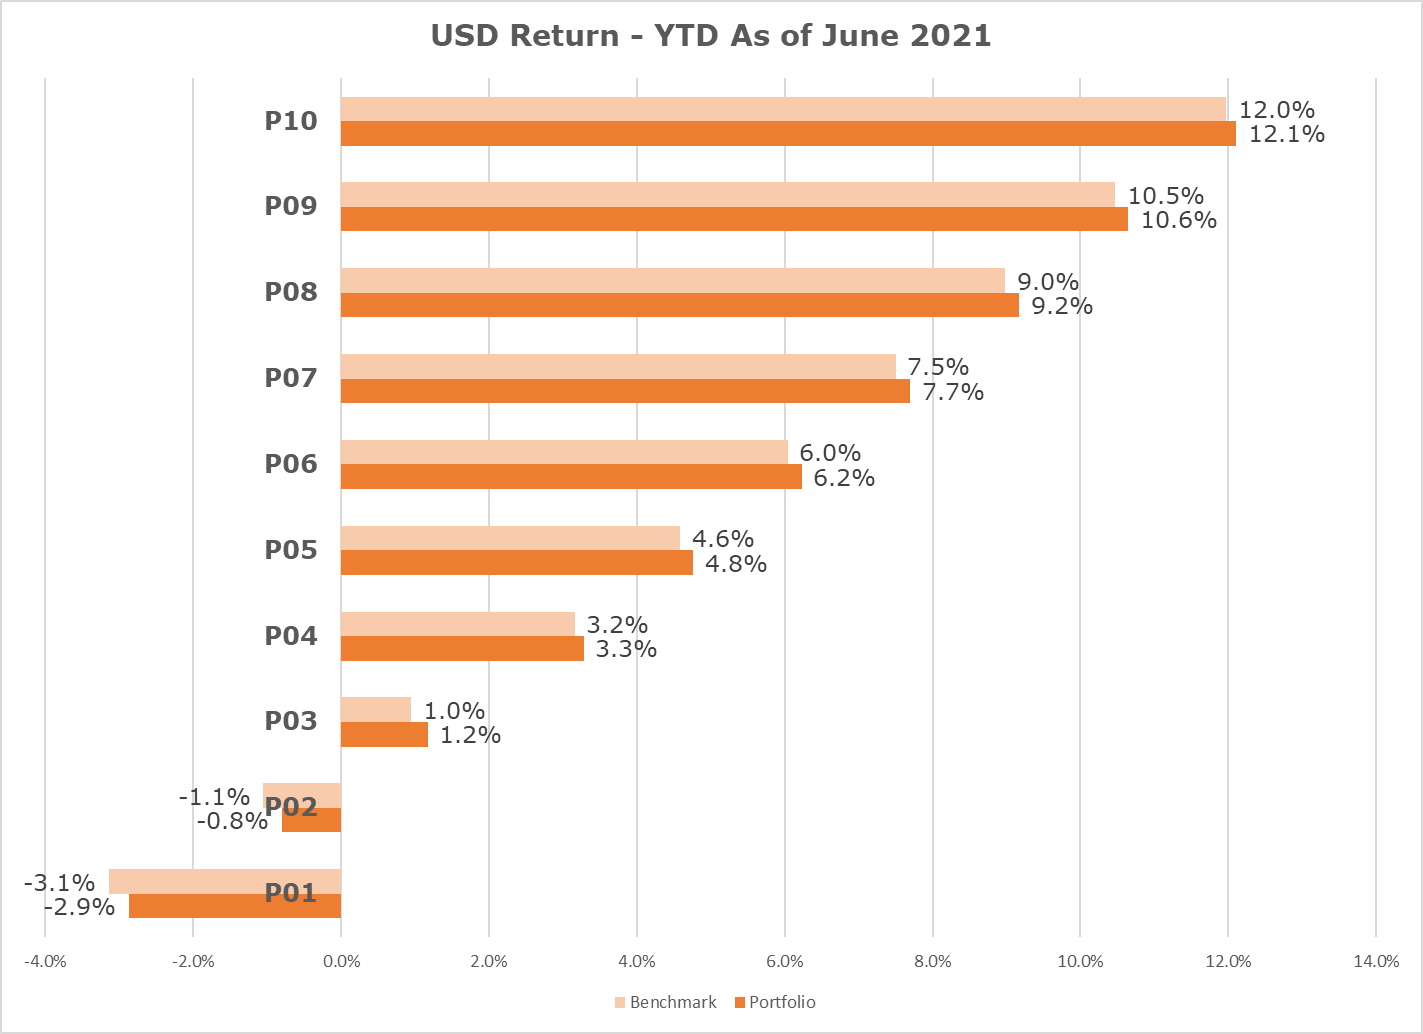
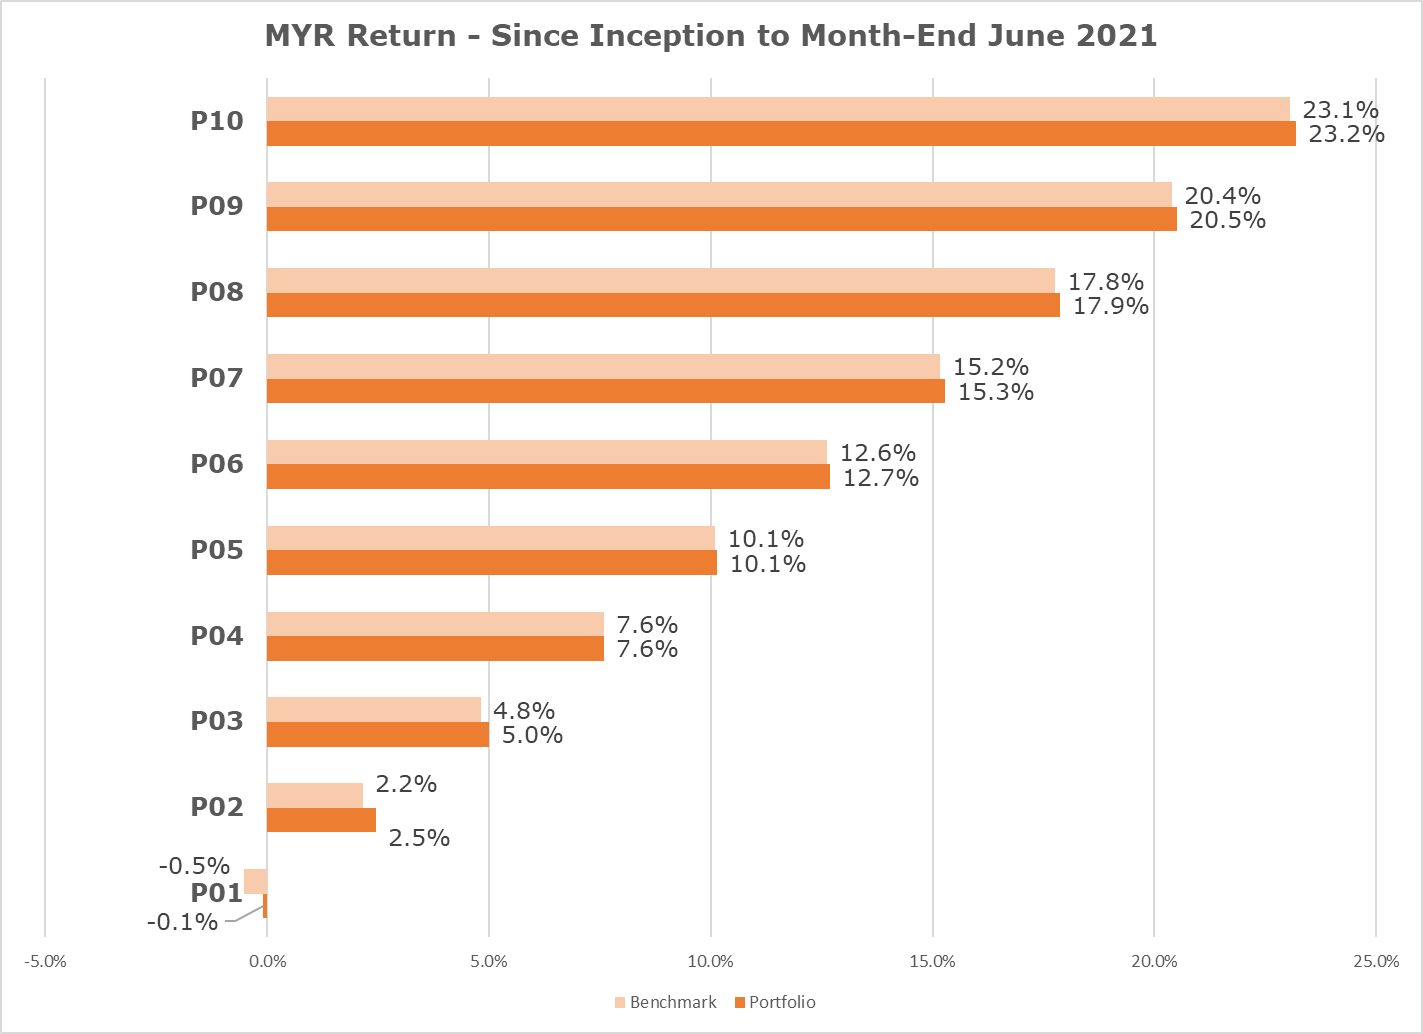
YTD and Since Inception (28 August 2020) to the Month Ended 30 June 2021 Performance
Akru’s Investment Philosophy
We construct optimally diversified global portfolios using ETFs with low expense ratios that track the underlying benchmarks closely.
Historical Portfolio Composition
Currently, Akru’s portfolios have 5 ETFs comprising 3 equity ETFs and 2 fixed income ETFs, except for P01-P03 which include an additional 2 local fixed income mutual funds. We calculate portfolios’ total returns that have included ETF and mutual fund fees before any fees payable to Akru.

Source: Morningstar
Since its inception, P04-P010 tracked very closely to their respective benchmarks. The slight tracking differences were generally attributable 3-10bps premium of Developed Market ex-US, Emerging Market and Global Fixed Income ETFs relative to their respective Net Asset Values. The tracking differences in P01-P03 were attributable to the outperformance of the fixed income mutual funds relative to its benchmark.

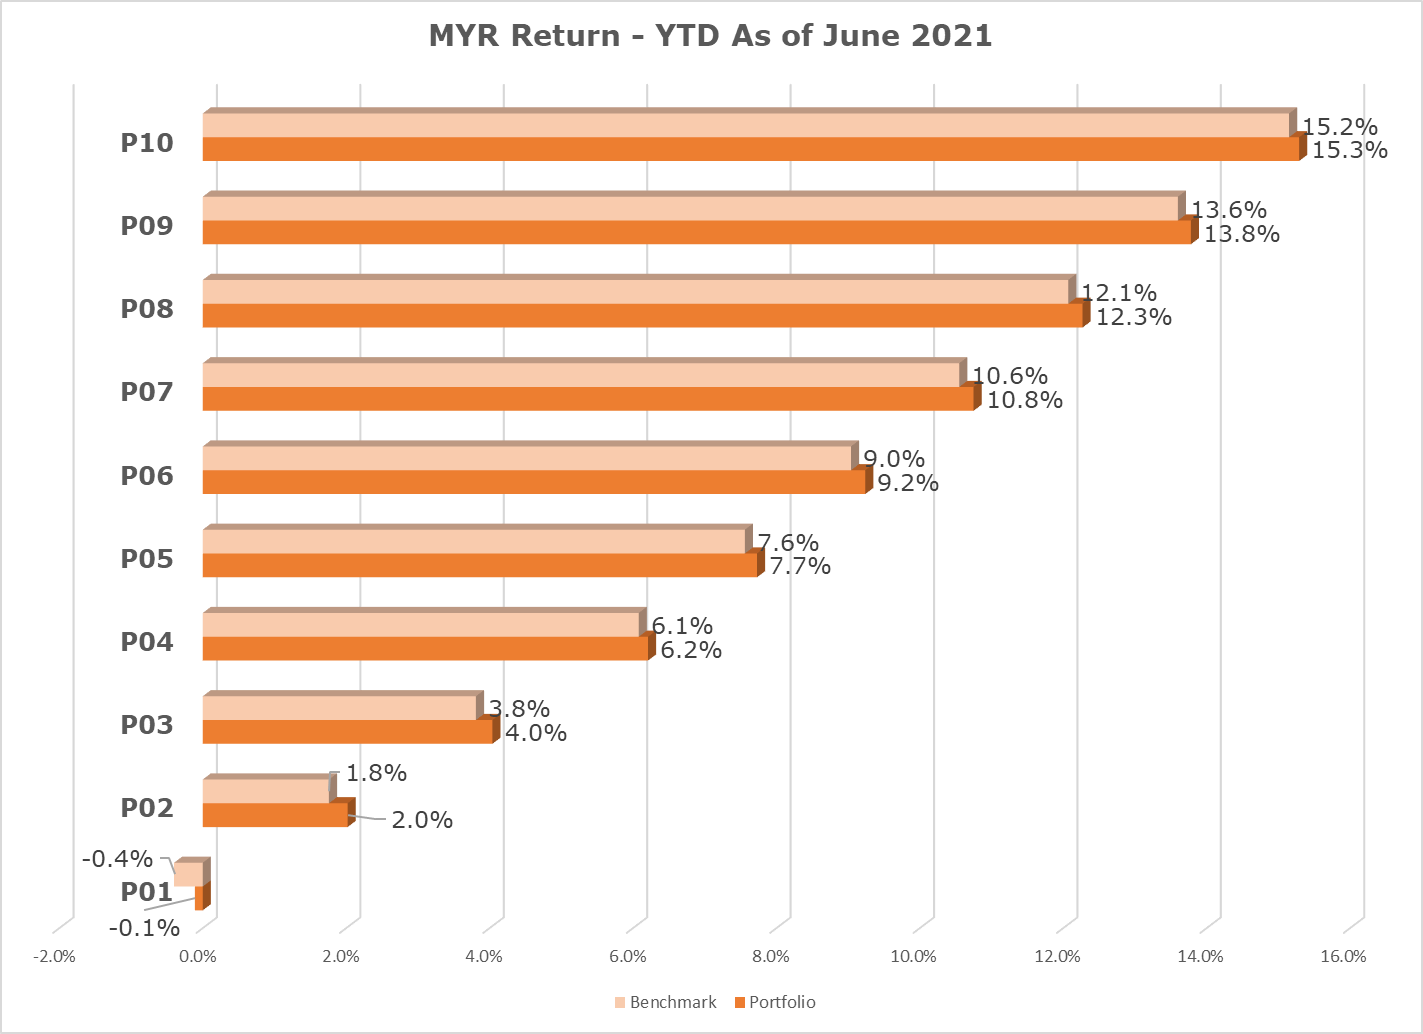
Source: Morningstar
On a YTD-2021, P04 and P10 tracked very closely to their respective benchmark. The tracking differences in P01-P03 were attributable to the 9-26bps outperformance of the fixed income mutual funds relative to its benchmark. The tracking differences for P04-P10 were due to 3bps to 10bps premium of Developed Market ex-US, Emerging Market and Global Fixed Income ETFs relative to their respective Net Asset Values.
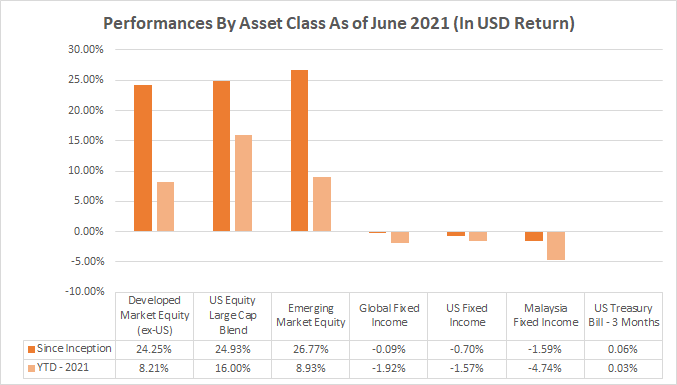
On a global basis, the emerging market equity has been laggard since the vaccine announcement in early November 2020. It was attributable to:
- the high weighting towards technology stock in the emerging market benchmark, which suffered from increasing regulation on Chinese technology companies, particular their foray into financial services;
- concerns of slow credit growth in China; and
- the slow rollout of the COVID-19 vaccine.
US equity continued its strengths in 2021, given the shattered earnings expectation in 1Q21 corporate earnings seasons.
While the fixed income markets declined amid fears of potentially higher inflation sparked by extraordinary new stimulus measures in the US, including the US$1.9 trillion COVID relief bill. Bond yields moved sharply higher worldwide even the central bankers vowed to keep interest rates low and maintain large-scale bond-buying programs. Malaysia fixed income continued to be impacted by concerns about potentially more fiscal stimulus following the announcement of total lockdown beginning June.
However, the portfolios’ total returns translated to RM since inception are lower as Ringgit appreciated slightly by 0.48%. Whereas on a YTD basis, total returns are higher by 3.52%, as the Ringgit depreciated.

Source: Morningstar

Benchmarks
We use market indices that mimic how the underlying ETFs and mutual funds perform to construct the blended benchmark, which comprises the following and according to each portfolio’s respective asset allocation.
| Asset Class | Benchmark |
|---|---|
| Developed Market Equities Large Cap (ex-US) | MSCI EAFE |
| US Equity Large Cap Blend | S&P 500 |
| Emerging Market Equities | MSCI Emerging Market |
| Global Fixed Income | Bloomberg Barclay Global Aggregate Ex USD Float Adjusted |
| US Fixed Income | Bloomberg Barclay US Aggregate Float Adjusted |
| Malaysia Fixed Income | Markit iBoxx ALBI Malaysia |

Disclosures
Past data and performance do not indicate future performance. Actual individual investor performance will vary depending on the initial investment, amount and frequency of contributions, allocation changes, taxes and fees during the time frame considered.

